Visa: a record $45.9 billion year and a slower 2027 outlook, read two ways
Visa Inc. (V) net revenue rose 15% to a record $45.9 billion in fiscal 2026 and 13% in the fourth quarter, and it guided to low-double-digit growth for fiscal 2027, its earnings release, presentation and call show.
Key figure: V fiscal 2026 net revenue, $45.9B, up 15% from a year earlier. Source: Visa earnings release, Oct. 27, 2026.[1]
The bull case
- Record year. Net revenue rose 15% to $45.9 billion for the fiscal year ended Sept. 30, and 13% to $12.1 billion in the fourth quarter, when non-GAAP EPS rose 17% to $3.48. Cross-border volume grew 14% and processed transactions 10%.[1]
- Value-added services are growing faster. Other revenue rose 40% in the quarter.[1] Value-added services revenue grew 30% in constant dollars for the year, and commercial and money movement revenue 19%, the CFO said.[3][4]
- $22.1 billion of free cash flow for the year.[2] The quarterly dividend rises 16% to $0.780, and $24.4 billion of repurchase authorization remains.[1]
- New rails. Stablecoin settlement passed a $25 billion annualized run rate, up 10 times from a year earlier, on 10 blockchains, management said.[3][4] The 2027 outlook assumes business drivers improve modestly as Visa laps the impact of last year’s Middle East conflict.[3][4]
The bear case
- Growth slows in 2027. Visa guides fiscal 2027 net revenue and operating expense growth to the low double digits and non-GAAP EPS growth to low double digits to low teens, after 16% in 2026 (about 15% in constant dollars).[1][2] The CFO called the second quarter “the growth low point.”[3][4] A lower-than-expected tax rate helped the fourth-quarter EPS beat.[3][4]
- Incentives outran revenue. Client incentives rose 21% to $5.1 billion in the quarter, against 13% net revenue growth.[1] About 25% of payments volume is up for renewal in 2027, versus about 20% in 2026, and management expects incentive growth to step up.[3][4]
- Cross-border revenue lagged volume. International transaction revenue rose 8% while cross-border volume excluding intra-Europe rose 14%.[1] The outlook assumes currency volatility stays near fourth-quarter levels, a drag for the full year.[3][4]
- Payouts topped free cash flow. Repurchases and dividends of $25.6 billion exceeded $22.1 billion of free cash flow, and cash and equivalents fell to $12.9 billion from $17.2 billion.[1][2] Litigation provisions totaled $1.76 billion for the year.[1]
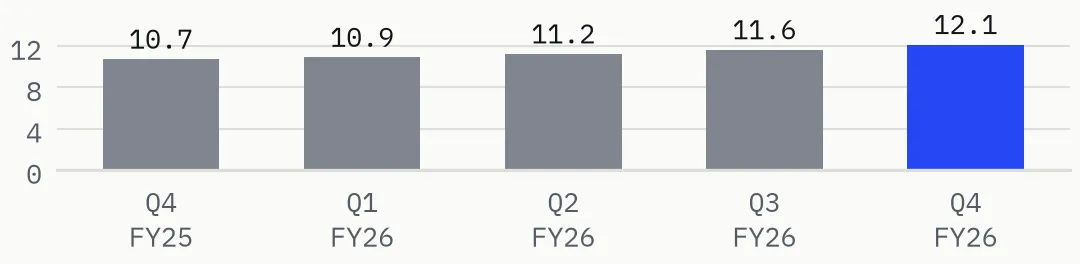
Exhibit 1. Net revenue rose 13% to $12.1B in fiscal Q4 2026. Quarterly net revenue, $B. Fiscal years end Sept. 30. The fiscal 2027 outlook is low-double-digit growth. Source: Visa earnings release and presentation, Form 8-K. Chart: New Street.[1][2]
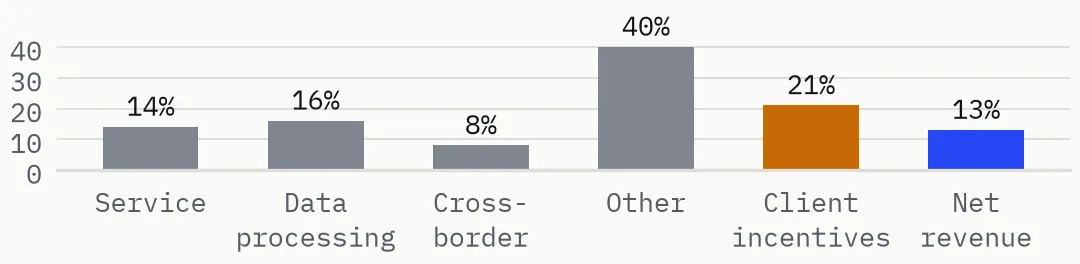
Exhibit 2. Client incentives grew faster than net revenue. Fiscal Q4 2026 growth from a year earlier, by line. Cross-border = international transaction revenue. Incentives are deducted from gross revenue. Source: Visa earnings release, Form 8-K. Chart: New Street.[1]
Market data: V closed at $401.86 on Oct. 27 (StockAnalysis, CompaniesMarketCap),[5][7] a market value of about $738B to $754B, No. 20 among listed companies as of 9:26 a.m. ET Oct. 28 (StockAnalysis, CompaniesMarketCap).[6][7] Consensus fiscal 2027 EPS was $15.04 (S&P Global via StockAnalysis, updated Oct. 28; Investing.com, compiled before the new outlook), about 27 times that estimate.[8][9]
New Street calculations (from primary figures): Free cash flow = net cash from operating activities minus capital expenditures: $23,728M - $1,671M = $22,057M for fiscal 2026, as in the presentation [2]. Repurchases and dividends = $20,515M (including applicable taxes) + $5,112M = $25,627M, shown as $25.6B, the release figure [1][2]. Litigation provision (GAAP operating expense line) = $1,764M for fiscal 2026 vs $2,562M for fiscal 2025 [1]. Exhibit 1 uses the release’s quarterly results table [1]. Exhibit 2 growth rates are nominal, as reported in the release; client incentives are a contra-revenue item [1]. Non-GAAP EPS growth in fiscal 2026 = $13.27 / $11.47 - 1 = 15.7%, reported as 16% [1]. P/E on fiscal 2027 consensus EPS = $401.86 / $15.04 = 26.7 [5][8][9]; [8] was updated Oct. 28, after the Oct. 27 outlook, [9] predates it, and both may change. Market value range reflects different share counts used by [6] and [7].
Sources
- Visa Reports Fiscal Fourth Quarter and Full-Year 2026 Results (Form 8-K Ex. 99.1, Oct. 27, 2026)
- Fiscal Fourth Quarter 2026 Financial Results, earnings presentation (Oct. 27, 2026)
- Visa Q4 2026 Earnings Call Transcript (Oct. 27, 2026)
- Earnings call transcript: Visa tops Q4 2026 estimates, shares slip after hours
- Visa (V) stock price history
- Biggest companies in the world by market cap
- Largest companies by market cap
- Visa forecast
- Visa fiscal earnings preview: guidance and VAS growth in focus (Oct. 27, 2026)